In a formal production environment, database performance and latency are critical to ensuring the stable and efficient operation of the system. Especially when interacting with the CnosDB database, it becomes important to gain a deeper understanding of its performance. At this time, the Jaeger distributed tracing system plays a huge role. In this blog, we will delve into how to trace and monitor the CnosDB database using Jaeger to gain a more complete understanding of its performance, latency, and potential issues.
About Jaeger and CnosDB
Jaeger: Jaeger is a powerful open source distributed tracing system, compatible with OpenTracing API, and designed for monitoring and debugging the request process in software service architecture. By capturing the flow of requests between different microservices, Jaeger helps developers identify performance bottlenecks and potential issues.
CnosDB: CnosDB is a high-performance open source database commonly used to store and manage large amounts of time series data. In a microservices architecture, CnosDB often acts as a backend for data storage and retrieval.
Enable Jaeger Support in CnosDB
Cancel the [trace] [ https://docs.cnosdb.com/zh/latest/reference/config.html#trace ]
configuration comment to enable the Jaeger tracing function.
| Tip: To make the configuration take effect, you need to restart the service.
[trace]
auto_generate_span = false
[trace.log]
path = '/tmp/cnosdb'
[trace.jaeger]
jaeger_agent_endpoint = 'http://127.0.0.1:14268/api/traces'
max_concurrent_exports = 2
max_queue_size = 4096
Install and Start Jaeger
| For other deployment methods, please refer to Jaeger Deployment [ https://www.jaegertracing.io/docs/deployment/ ]
docker run -d --name jaeger \
-p 6831:6831/udp \
-p 6832:6832/udp \
-p 16686:16686 \
-p 14268:14268 \
jaegertracing/all-in-one:latest
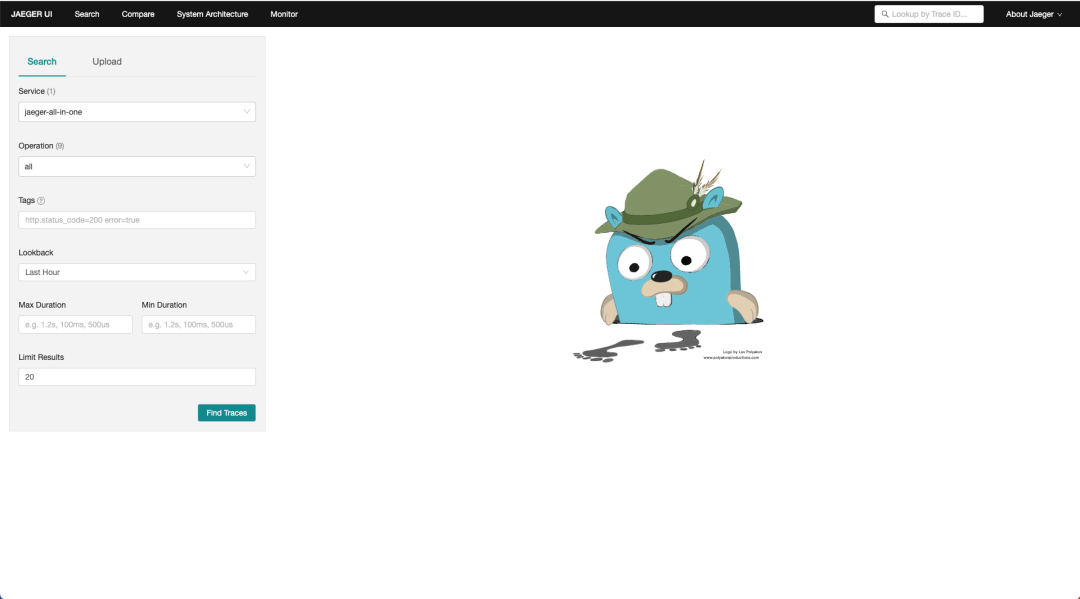
After successful startup, use your browser to access http://127.0.0.1:16686

Track Event in CnosDB
1. Add span context to the request.
| You can set auto_generate_span = true in the configuration file to automatically generate it. If you need to analyze a specific statement, please customize the uber-trace-id value in the request. The format is as follows (for detailed format instructions, please refer to: Propagation Format [ https : / /www.jaegertracing.io/docs/1.46/client-libraries/#propagation-format ])
uber-trace-id: 3a3a43:432e345:0:1Example:
| For the data source in the example, please refer to: https://docs.cnosdb.com/zh/latest/start/quick_start.html
Query the data in the air table in the database oceanic_station, sort it in reverse chronological order, and return the first 5 pieces of data.
curl -i -u "root:" -H "Accept: application/json" -H "uber-trace-id: 3a3a43:432e345:0:1" -XPOST "http://127.0.0.1:8902/api/v1/sql?db=oceanic_station&pretty=true" -d "select * from air order by time desc limit 5;"Use Dashboards for Analysis


- Record span:
When a client application sends a query or write request to the CnosDB database, CnosDB sends the resulting Span record to Jaeger. Each span represents a stage of the request, including processing time, operation name and other related information.
- Select Service:
In the Service drop-down box of the Jaeger user interface, select the service related to CnosDB (for example: cnosdb_singleton_1001).
- Find Traces:
On the interface, click the “Find Traces” button and the system will retrieve all traces related to the selected service. This will display a series of requests and corresponding spans.
- Analyze Trace details:
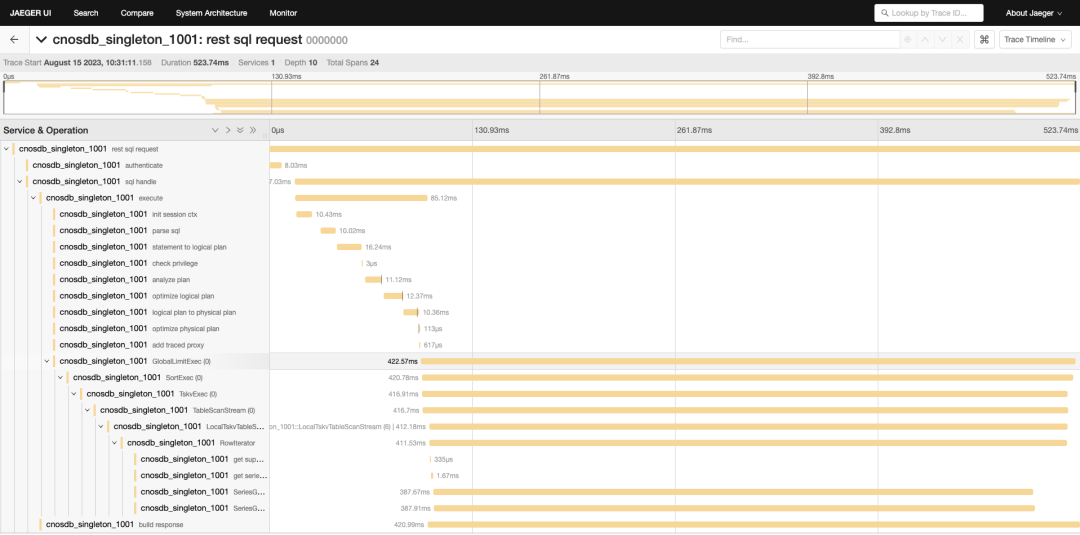
Click on the trace of interest to enter the detailed view. In this view, you will see the entire request process and the execution time of each span. This timing information will help you understand how long each step of your query takes to process.
- Optimize queries and systems:
With detailed time logging, you can accurately analyze query performance. In a formal production environment, this will become a valuable tool for optimizing query statements and improving system performance. By analyzing the execution time of each span, you can find steps that may cause delays and take targeted optimization measures.
In addition, Jaeger can also track other events of CnosDB, as follows:
- Query component
- REST API
- Arrow Flight SQL API
Conclusion
Extended example
curl -i -u "root:" -H "Accept: application/json" -H "uber-trace-id: 3a3a43:432e345:0:1" -XPOST "http://127.0.0.1:8902/api/v1/sql?db=usage_schema&pretty=true" -d "select * from user_queries order by time desc limit 5;"curl -i -u "root:" -H "Accept: application/json" -H "uber-trace-id: 3a3a43:432e345:0:1" -XPOST "http://127.0.0.1:8902/api/v1/sql?db=usage_schema&pretty=true" -d "CREATE TABLE air (visibility DOUBLE,temperature DOUBLE,presssure DOUBLE,TAGS(station));"curl -i -u "root:" -H "Accept: application/json" -H "uber-trace-id: 3a3a43:432e345:0:1" -XPOST "http://127.0.0.1:8902/api/v1/write?db=public&pretty=true" -d "ma,station=XiaoMaiDao visibility=50,temperature=63,pressure=52"Using Prometheus for remote reading and writing
remote_write:url: "http://127.0.0.1:8902/api/v1/prom/write?db=prometheus"headers:: '3a3a43:432e345:0:1'basic_auth:username: 'root'password: ''remote_read cnosdbremote_read:url: "http://127.0.0.1:8902/api/v1/prom/read?db=prometheus"headers:: '3a3a43:432e345:0:1'basic_auth:username: 'root'password:
curl -i -u "root:" -H "Accept: application/json" -H "uber-trace-id: 3a3a43:432e345:0:1" -XPOST "http://127.0.0.1:8902/api/v1/opentsdb/write?db=public" -d 'opentsdb 1689054412124000000 1 tag1=t1 field1="f1" value1=1'curl -i -u "root:" -H "Accept: application/json" -H "uber-trace-id: 3a3a43:432e345:0:1" -XPOST "http://127.0.0.1:8902/api/v1/opentsdb/put?db=public" -d '[{"metric":"tsdbput","timestamp": 1689069407572000000,"value": 9,"tags":{"tag1":"t1","tag2":"t2"}}]'