

Observability refers to gaining deep insights into a system's operational state, performance, and root causes of issues by collecting and analyzing various metrics and log data, thereby enhancing system reliability and maintainability.
In modern software development, good observability helps developers and operations teams better monitor system status, identify potential issues, and take timely action to resolve them. Time-series databases have become popular components for building observability solutions due to their efficient handling of time-series data.
Among the many time-series databases, CnosDB stands out as a high-performance, high-compression, and easy-to-use open-source distributed time-series database driven by the community. It provides an effective full-stack solution for industries like energy, manufacturing, and finance that have high demands for real-time data insights. CnosDB features large data scale capabilities, fast bulk writes, high data compression, rich computation functions, and an excellent ecosystem.
This article introduces best practices for building an observability system using Prometheus and Grafana in combination with CnosDB.
Solution Architecture
Prometheus and Grafana form a popular open-source monitoring system, working together to provide powerful monitoring and visualization capabilities. By adding CnosDB, they create a short and long-term storage ecosystem that optimizes the observability solution.
For example, Amazon Managed Service for Prometheus can store data for up to 150 days. In scenarios requiring large-scale historical data, such as device failure prediction, network traffic analysis, and predictive scaling, Prometheus's data capacity may fall short. Using CnosDB as storage alleviates this concern.

Prometheus is an open-source system monitoring and alerting toolkit. It continuously pulls monitoring data from targets and stores it in an efficient time-series database.
Amazon Managed Grafana is a fully managed service for Grafana, integrating with multiple data sources (such as Prometheus and Elasticsearch) and providing rich visualization capabilities. It allows customized metrics, logs, and trace visualizations.
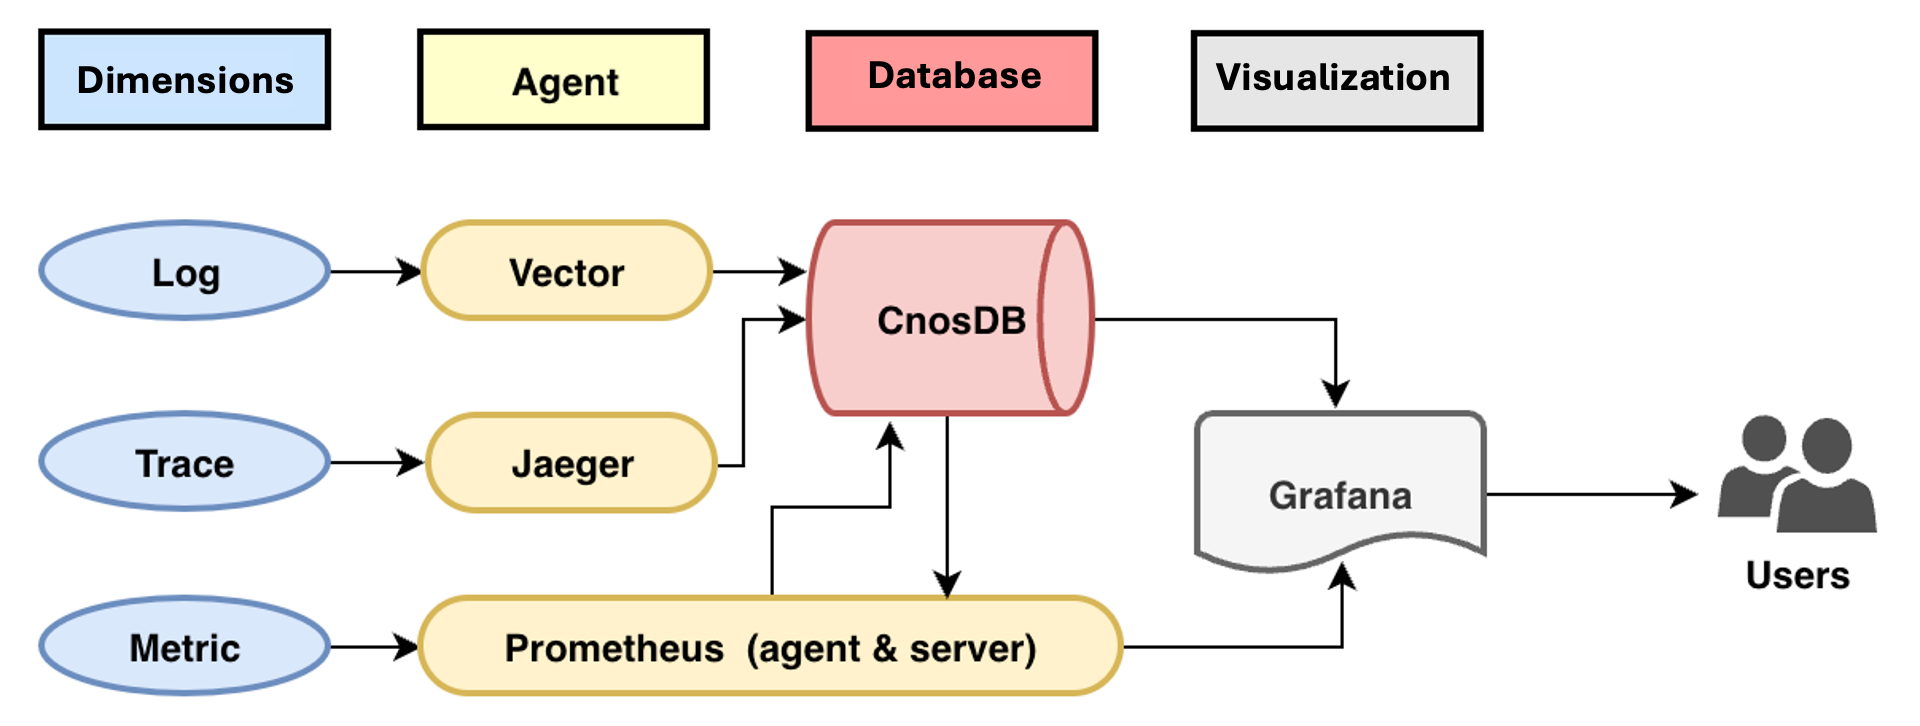
In the diagram, CnosDB acts as the time-series database, storing metric data pulled by Prometheus and providing a data read interface for the Prometheus server. Users can use Prometheus as a data source in Grafana to access Prometheus's built-in dashboards or use the CnosDB plugin to access CnosDB data sources and create custom dashboards with SQL.
Deployment and Implementation
CnosDB Deployment
CnosDB has both open-source and enterprise versions and can be deployed in several ways:
– Docker
– Amazon EC2
– Amazon EKS
This article uses Helm to deploy CnosDB on EKS. After creating the EKS cluster, run the following commands:
helm repo add cnosdb https://cnosdb.github.io/helm-chart/
helm repo update cnosdb
helm install my-cnosdb cnosdb/cnosdb -n cnosdb -f bundle.yaml
The YAML file is as follows:
image:
pullPolicy: IfNotPresent
cnosdbMeta:
tag: community-2.3.5.2
cnosdb:
tag: community-2.3.5.2
architecture: separation
tskv:
persistence:
storageClass: “gp3”
enabled: true
size: 10Gi
meta:
persistence:
storageClass: “gp3”
enabled: true
size: 10Gi
After successful deployment, run kubectl get all -n cnosdb to see the following result:
Enter the query pod and execute cnosdb-cli to create a Prometheus database to receive Prometheus data.
Prometheus Deployment on EKS
Use Helm to create the Prometheus YAML file as follows:
server:
remoteWrite:
– url: “http://my-cnosdb-query-svc.cnosdb.svc.cluster.local:8902/api/v1/prom/write?db=prometheus”
basic_auth:
username: ‘root'
password: ”
remoteRead:
– url: “http://my-cnosdb-query-svc.cnosdb.svc.cluster.local:8902/api/v1/prom/read?db=prometheus”
basic_auth:
username: ‘root'
password: ”
The remoteWrite and remoteRead IPs are the svc addresses of the CnosDB query service deployed in the previous step, and the `db` parameter is the name of the database created to store Prometheus data.
helm repo add prometheus-community https://prometheus-community.github.io/helm-charts
kubectl create ns prometheus
helm install prometheus-for-amp prometheus-community/prometheus -n prometheus -f deploy.yaml
After successful deployment, execute kubectl get all -n prometheus to see the following result:

Then check the Prometheus database in CnosDB, where you can find multiple data tables created by Prometheus after writing data.

Amazon MSG Deployment
Create a workspace in Amazon Managed Grafana.

Here, a workspace named `eks-metric` was created. Authentication is selected as IAM Identity Center.

Create access users for the IAM Identity Center.

Assign access permissions to the created user for the workspace.
(Optional) Plugin Configuration: CnosDB has contributed a dedicated plugin to the Grafana community, allowing users to directly read data from CnosDB for visualization. To use this plugin, enable plugin management in the AMG workspace.

Configure VPC outbound connection to grant AMG connection permissions for the EKS VPC.

Visualization
Log in to the AMG web page with the user created in the third step. In the left sidebar, find `Datasource` and click `Add data source`.

Using Prometheus Data Source
Select Prometheus and add the access address of the Prometheus server deployed in the EKS cluster.

Here, a load balancer type service was configured for the Prometheus server. After connecting successfully, you can visualize the collected metric data through Grafana.

Click `Building a dashboard`, select the Prometheus data source, choose a metrics type, and execute `Run queries` to get the corresponding visualization result.

Using CnosDB Data Source
In the left sidebar, select `Add new connection`, search for and find the CnosDB plugin.

After successfully installing, click `Add new data source` to add the CnosDB data source.

Select the database that stores the Prometheus data, default user is `root`, and password is empty. Similarly, configure the load balancer type for `my-cnosdb-query-svc`, choose the svc external IP, and add port 8902.

After successfully configuring the data source, use SQL queries to directly fetch data from CnosDB and generate visualization charts.
Conclusion
Overall, the monitoring system composed of CnosDB, Prometheus, and Grafana is suitable for real-time monitoring and metrics, elastic scaling, data visualization and reporting, alerting and warning, and container and microservices monitoring scenarios. This article demonstrates the architecture of the entire observability system through the deployment of the metric data observability solution.
In this solution, Prometheus's many default chart templates allow users to visualize data directly through the Prometheus data source. CnosDB mainly serves as long-term storage for Prometheus. Additionally, if users can't find the desired content in the default templates, they can use the CnosDB plugin to query data directly with standard SQL.
Furthermore, in the log and trace monitoring dimensions, CnosDB can directly accept data written by corresponding collectors and visualize it in Grafana.